The what, why and how of A/B testing
A/B testing can be a very valuable technique to optimize your website and online content. Nowadays all big companies are continuously running A/B tests in order to learn about their audience preferences and enhance the effectiveness of their online efforts. But what are A/B tests? Why do companies use them? And how do you run a successful A/B test? No need to look further! All the answers to your questions are below

What?
An A/B test, also known as a split test, is an experimental process where marketers divide their target audience into two groups (A and B) and show them different versions of a certain image, webpage, campaign, email or other content. One group is exposed to the original version and the other group is exposed to the new version. The goal of this process is to test how one version performs alongside another.
Let’s say you want to improve the click-through rate (CTR) of an important button on your homepage and (after a bit of analysis) think the colour of this button could play a crucial role in this. To run an A/B test, you’ll need to create two different versions of your homepage: a “control” homepage where the button has its original colour, green for example, and a new “test” homepage where you change the colour of the button to red. You’ll then split the visitors of your homepage into two similarly sized audiences and show them either one of the versions. After a predefined period of time you should be able to analyze whether there is a statistically significant difference between the two button colours or not. Suppose the CTR of the new red button is significantly higher than the red one, then the marketers should strongly consider changing the button colour to red.
Note that in this example we only changed one single variable: colour. If we would also change the position and size of the button on our test homepage, we wouldn’t be able to attribute the outcome of our test solely to the colour. In order to test changes in multiple variables, we could conduct a multivariate test. Tip: if you don't know what element has most effect on a website, you can use a multivariate test to find out, and then use A/B testing to optimize that element.
It’s also possible to involve more than two variations for one variable in your test. Assume you would also create versions of your homepage with an orange or yellow button. Or maybe you even want to test 41 different shades of blue. As long as you only change one single variable in your versions, the A/B test principles would still apply. We call this an A/B/n test, where “n” refers to the extra number of variations being tested.
Why?
A/B testing is a great way to cater short-term business questions and optimize your online channels. It can help you make calculated marketing decisions instead of relying on guesses or assumptions. It also enables you to learn about user behavior, enhance your online user experience and collect data about it. in addition, most A/B tests are low in cost, but could be high in reward if conducted correctly.
Another major benefit of A/B testing is the ease of analysis. It’s relatively simple to determine which version scores best based on the metrics you chose to evaluate the test.
A/B testing isn’t something you should do on a sporadic base, but more of a continuous process. You should consistently try to improve your user experience by testing new variations in order to maximize your conversion rate over time.
How?
Performing an A/B test shouldn’t necessarily be a complex task. Here are seven steps to guide you through the process:
Step 1: Choose the variable you want to change.
Identify goals, collect data and gain insights into your current performance. Are there underperforming pages or lagging call-to-actions? Which goals have low conversion rates? Questions like these could be used as a starting point to come up with all sorts of enhancements. Pick one independent variable, like button colour for example, and think of possible alternatives to test. Other examples are design, images or wordings. Even the simplest changes in variables could lead to interesting opportunities. But remember: don't just base your changes on gut feeling!
Step 2: Pick a metric and design a hypothesis.
In order to determine which of your versions performs the best, you need to pick one primary success metric to evaluate your test. Examples of success metrics are click-through rate, button clicks, signups, purchases or bounce rate.
Before you run an A/B test, make sure to state a hypothesis. This will serve as a statement of what to expect for your test. Hypothesis should always follow a certain structure, for example: “if we change variable A to variable B, we expect an improvement in metric X.” At the end of the testing period you should be able to measure the impact of your changes and either accept or reject the hypothesis.
Step 3: Design a control version and a new version.
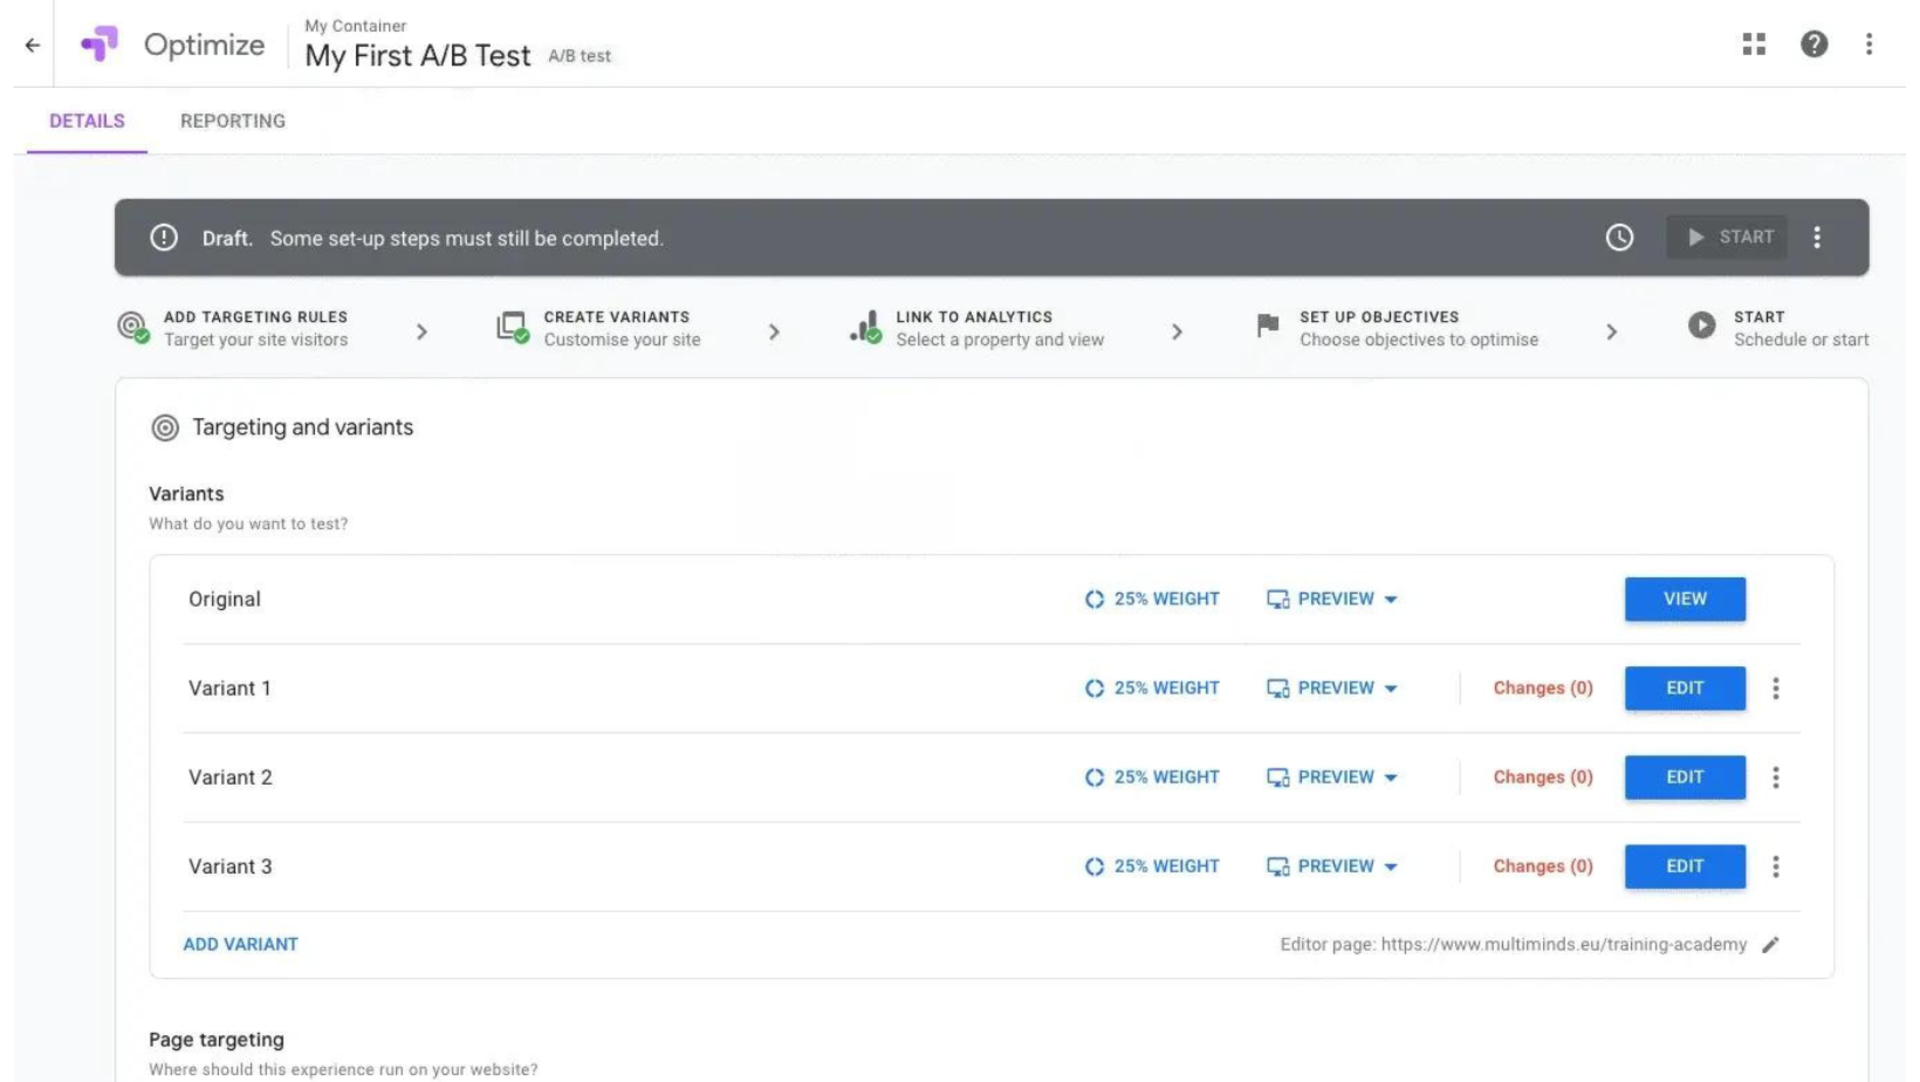
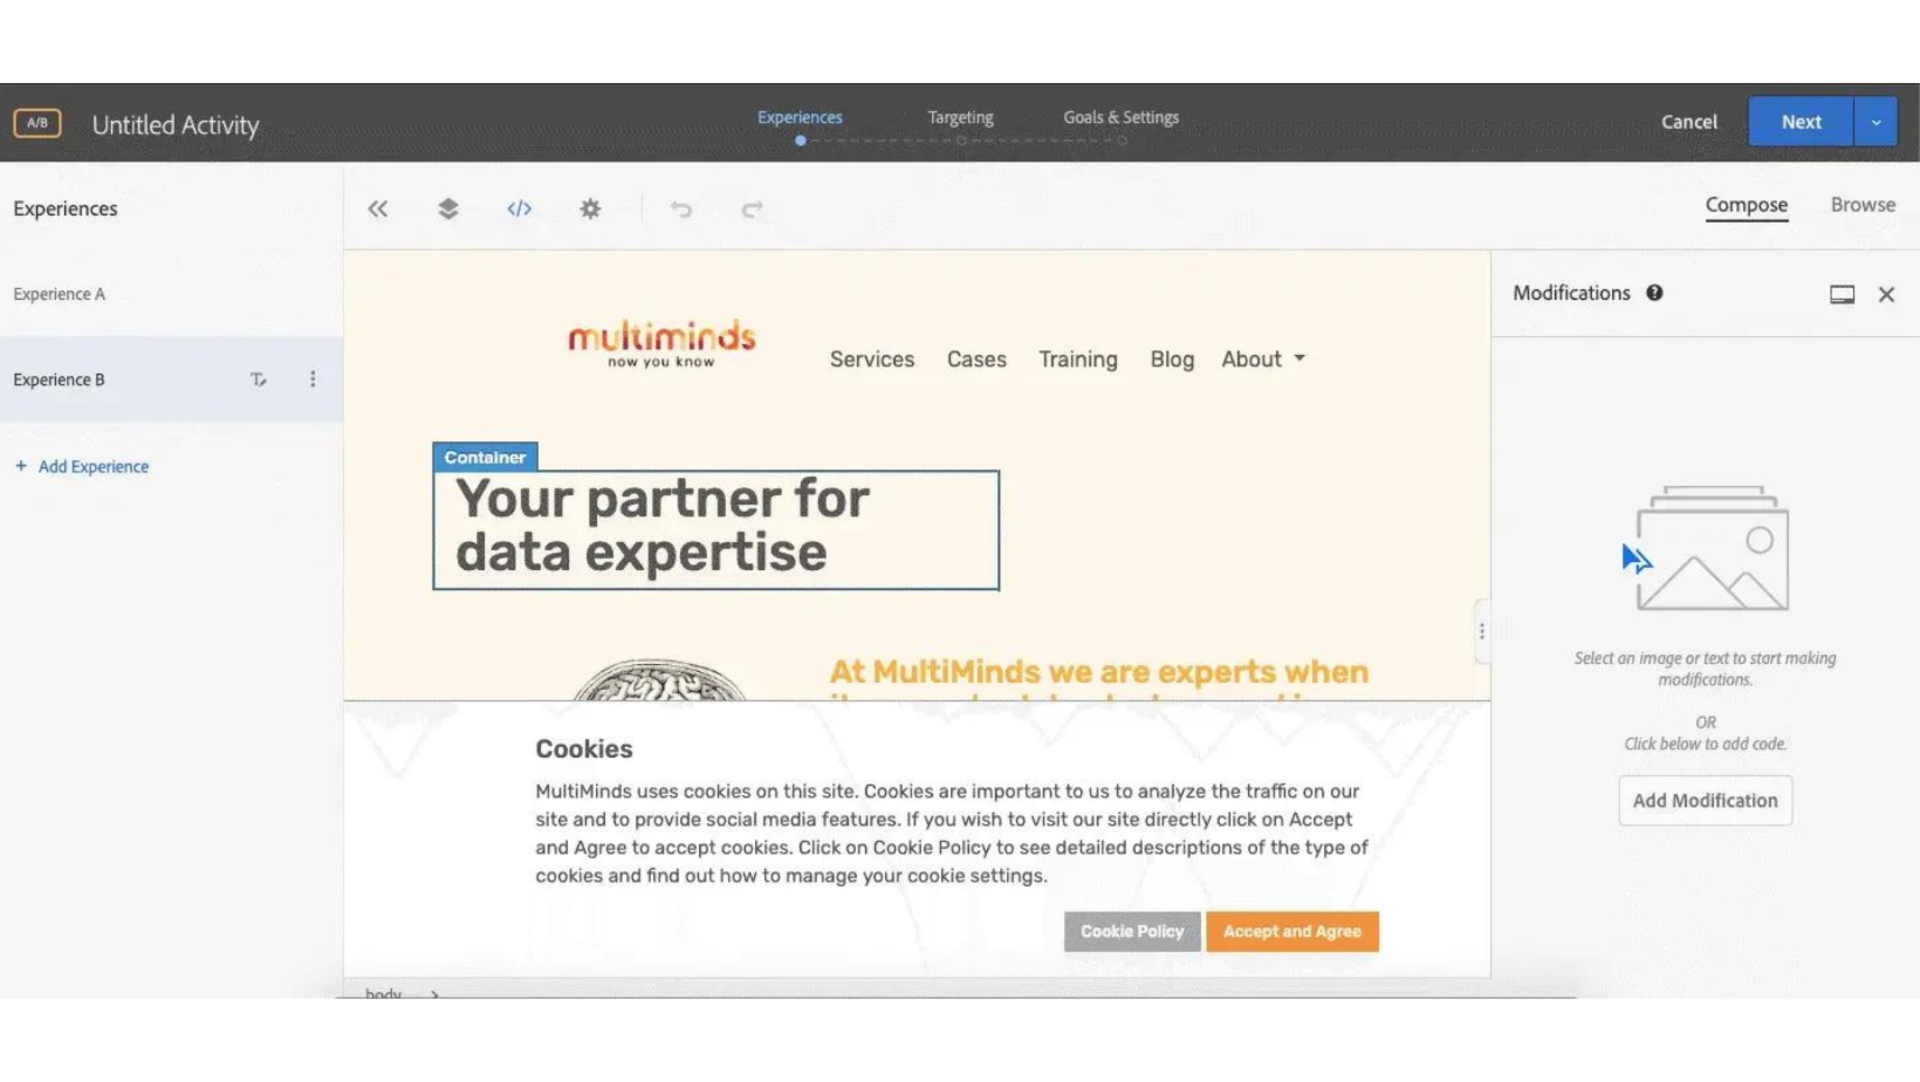
You have chosen the variable you want to test and the metrics and a hypothesis to evaluate your test. Now it’s time do design a control version, in most cases the current version, and new version of your webpage, email or whatever content you’re testing. Most A/B testing software, like Google Optimize, Adobe Target or Optimizely, offer the ability to make the changes in their visual editor, which makes the design process a whole lot easier. Don’t forget to double-check your new version to see if everything works correctly.
Step 4: Choose your sample size and test duration.
Before you hit “start” you’ll need to decide on the sample size, the distribution of the different versions and the duration of your test. It’s recommended to test with two or more equal audiences in order to have conclusive results, but if you’re unsure of how well a specific variant will perform, you may want to assign a smaller portion of your traffic to that variant. The test should run long enough to obtain a sufficient sample size and a statistically significant difference. Most marketers desire a confidence level of at least 95%.
Step 5: Perform the test.
Now it’s time to finally run your experiment. From the moment the test is launched participants will be randomly assigned to one of the versions and data about their interactions is being collected. Let the test run long enough to collect significant data.
Run one A/B test at a time in order to avoid simultaneous tests affecting each other’s results. Also keep in mind that external factors like holidays or seasonality may impact visitor behavior.
Step 6: Measure the outcome.
Never make decisions based on early results but wait patiently until the test is completed and stop the test at a predefined point and a sufficient sample size.
From the moment the testing stage is over you can start with the even more fun part: analysing your testing data. Although there are numerous metrics available to analyze the results, you should focus on the primary metric you’ve set in step 2. This metric will present you a clear image of the difference between the performance of the versions and whether or not this difference is statistically significant.
But the analysis doesn’t have to stop here. You can turn to your analytics tool and look at other important metrics. Or you can investigate how each of the variants performed in your different customer segments. A certain adaptation in one of the variants may boost conversion rates for one segment, while the conversion rates of other customer segments are still higher for the original version. Have a look at your mobile traffic, loyal customers or all sorts of demographics in order to discover new opportunities.
Step 7: Take action.
If there is a significant difference, you can determine a winner and implement this version. If there isn’t, the tested variable didn’t impact results. Stick with the original variant or run another test.
Finally, don’t forget to document your experiment. This can be useful to share your gathered knowledge with your colleagues. Even if the testing results didn’t turn out the way you expected, you can still see this as a learning opportunity for future tests.